دوره آمار با R
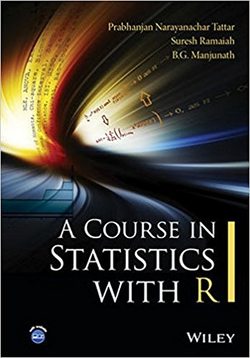
این کتاب، با ایجاد یکپارچگی بین مباحث تئوری و عملی آمار توسط R، نوشته شده است تا شکاف بین مطالب تئوری و عملی را پر کند و نحوه تبدیل عبارات ریاضی به دستورات R را توضیح میدهد. دوره آمار با R، در ابتدا به عنوان یک کتاب همراه سودمند برای دانشجویان کارشناسی ارشد در هر ترم از دوره آمار، طراحی شده بود، اما به آمارگیران در بازنویسی پایههای موضوع نیز کمک خواهد کرد.
با این هدف دوگانه در ذهن، کتاب با مبانی R شروع میشود و سریعا آنالیز اکتشافی و تجسم را پوشش میدهد. احتمال و استنتاج آماری، شامل گروههای کلاسیک، ناپارامتریک و بیزی، توسط تعاریف، عبارات ریاضی و دستورات R توسعه یافته است، به گونهای که به خواننده کمک میکند تا پیشرفت ریاضی و همچنین اجرای R را درک کنند. این کتاب مدلهای رگرسیون خطی، طرحهای آزمایشی، تحلیل چندمتغیره و آنالیز دادههای طبقهبندیشده را، با شیوهای که استفاده از تکنیکهای تجسم و تکنیکهای آماری اساسی مرتبط با آنها را از طریق کاربردهای عملی مؤثر میسازد، مورد بحث قرار میدهد. بنابراین به خواننده کمک میکند تا به درک روشنی از مدلهای آماری مربوطه برسد.
با این هدف دوگانه در ذهن، کتاب با مبانی R شروع میشود و سریعا آنالیز اکتشافی و تجسم را پوشش میدهد. احتمال و استنتاج آماری، شامل گروههای کلاسیک، ناپارامتریک و بیزی، توسط تعاریف، عبارات ریاضی و دستورات R توسعه یافته است، به گونهای که به خواننده کمک میکند تا پیشرفت ریاضی و همچنین اجرای R را درک کنند. این کتاب مدلهای رگرسیون خطی، طرحهای آزمایشی، تحلیل چندمتغیره و آنالیز دادههای طبقهبندیشده را، با شیوهای که استفاده از تکنیکهای تجسم و تکنیکهای آماری اساسی مرتبط با آنها را از طریق کاربردهای عملی مؤثر میسازد، مورد بحث قرار میدهد. بنابراین به خواننده کمک میکند تا به درک روشنی از مدلهای آماری مربوطه برسد.
سال انتشار: 2016 | 692 صفحه | حجم فایل: 8 مگابایت | زبان: انگلیسی
A Course in Statistics with R
نویسنده
Prabhanjan N. Tattar
ناشر
Wiley
ISBN10:
1119152720
ISBN13:
9781119152729
قیمت: 16000 تومان
برچسبها: Integrates the theory and applications of statistics using R A Course in Statistics with R has been written to bridge the gap between theory and applications and explain how mathematical expressions are converted into R programs. The book has been primarily designed as a useful companion for a Masters student during each semester of the course, but will also help applied statisticians in revisiting the underpinnings of the subject. With this dual goal in mind, the book begins with R basics and quickly covers visualization and exploratory analysis. Probability and statistical inference, inclusive of classical, nonparametric, and Bayesian schools, is developed with definitions, motivations, mathematical expression and R programs in a way which will help the reader to understand the mathematical development as well as R implementation. Linear regression models, experimental designs, multivariate analysis, and categorical data analysis are treated in a way which makes effective use of visualization techniques and the related statistical techniques underlying them through practical applications, and hence helps the reader to achieve a clear understanding of the associated statistical models.
Key features:
Integrates R basics with statistical concepts
Provides graphical presentations inclusive of mathematical expressions
Aids understanding of limit theorems of probability with and without the simulation approach
Presents detailed algorithmic development of statistical models from scratch
Includes practical applications with over 50 data sets










عالی هستید ممنون ازتون