جداول محوری اکسل 2013
جدول محوری روش ساده اما قدرتمندی است که کاربران اکسل را قادر میسازد دادههای بیش از حد را به دانش معنیدار و سازمان یافتهای تبدیل کنند. با جداول محوری میتوانید:
 دادههای زیادی را در روشهای مختلف با کشیدن ساده موس مشاهده کنید
محاسبات را سریع و بدون نیاز به فرمول انجام دهید
بر بخش دیگری از دادهها در هر زمان تمرکز داشته و تصویر روشنی از آن دریافت کنید
روندها و الگوهای بیشتری را نشان دهید
دهها نوع گزارش و نمودار برای تجزیهوتحلیل دادههای خود ایجاد کنید. با خواندن این کتاب و استفاده از فایلهای کاربردی آن میتوانید به راحتی از امکانات جداول محوری استفاده کنید، ازجمله ایجاد جدول محوری، انتخاب دادهها از فایل فعلی، تغییر منبع داده، ایجاد جدول محوری بر اساس جدول دادههای پویا، انجام محاسبات، نمایش مجوع در حال اجرا و غیره، همچنین برخی از نکات و ترفندها را میآموزید.
سال انتشار: 2015 | 155 صفحه | حجم فایل: 7 مگابایت | زبان: انگلیسی
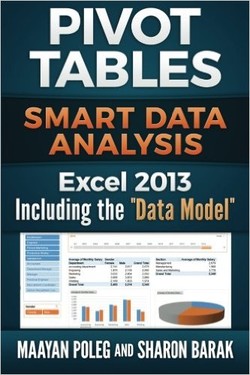
Excel 2013 Pivot Tables: Including the
نویسنده
Maayan Poleg, Sharon Barak
ناشر
CreateSpace Independent Publishing Platform
ISBN10:
1511954876
ISBN13:
9781511954877
قیمت: 16000 تومان
برچسبها: اکسل جداول محوری اکسلعناوین مرتبط:


Excel 2013 Pivot Tables Including the "Data Model" A pivot table is a simple, yet powerful technique, that enables Excel's users to transform data overload into meaningful and organized knowledge. With pivot tables you can: * See the data in dozens of different ways with a simple mouse drag * Perform fast calculations with no need for formulas * Focus on another part of the data each time and get a clear picture * Show more trends and patterns * Create dozens of reports and charts to analyze your data While reading the book and using the practice files, you will know to: Create a Pivot Table o Select data from the current file o Selec data from another Excel file o Change the data source o Create a pivot table based on a dynamic data table Perform Calculations: o Use sum, average, minimum, maximum and count o Show Percentage of a column total, row total and Grand total o Display the running total o Group numeric and date data o Use calculated field and calculated item Change The Report Structure o Switching columns and rows o Adding columns or rows o Adding a page break between items Format your Pivot Tables o Add totals and Subtotals o Sort o Filter You will also know to • Add slicers and to manipulate then • Add a timelines and to manipulate it • Add charts to your pivot tables • Use the new and innovative feature: "The Data Model" And, of course, You will learn some cool tips and tricks!