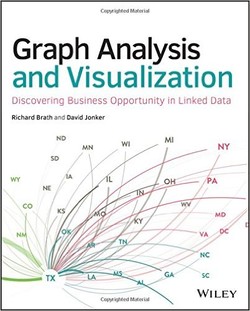
تحلیل و تجسم گراف
قیمت 16,000 تومان
کتاب “تحلیل و تجسم گراف” نظریه گراف را از محیط آزمایشگاهی خارج میکند و به دنیای واقعی میآورد. با استفاده از روشها و ابزار پیچیده که عملکرد تجزیه و تحلیل را گسترش میدهد، این راهنما به شما نشان میدهد که چگونه به بهرهبرداری از گراف و تکنیکهای تحلیلی شبکه که منجر به کشف بینشها و فرصتهای تجاری جدیدی میشوند؛ میپردازد.
این کتاب بهصورت تمامرنگی منتشر شده است و با استفاده از یک مجموعه غنی و جذاب از نمونههایی در ورزش، امور مالی، بازاریابی، امنیت، رسانه اجتماعی و موارد بیشتر دیگر، فرآیند ساخت تجسم قدرتمند را توصیف میکند. در این کتاب راهنماییهای کاربردی برای شناسایی الگو و استفاده از منابع داده مختلف، از جمله دادههای بزرگ، همچنین دستورالعمل شفاف در زمینه استفاده از نرمافزار و برنامهریزی را پیدا خواهید کرد.
سال انتشار: 2015 | تعداد صفحات: 538 | حجم فایل: 127.62 مگابایت | زبان: انگلیسی
Graph Analysis and Visualization: Discovering Business Opportunity in Linked Data
نویسنده:
Richard Brath, David Jonker
Wring more out of the data with a scientific approach to analysis
Graph Analysis and Visualization brings graph theory out of the lab and into the real world. Using sophisticated methods and tools that span analysis functions, this guide shows you how to exploit graph and network analytic techniques to enable the discovery of new business insights and opportunities. Published in full color, the book describes the process of creating powerful visualizations using a rich and engaging set of examples from sports, finance, marketing, security, social media, and more. You will find practical guidance toward pattern identification and using various data sources, including Big Data, plus clear instruction on the use of software and programming. The companion website offers data sets, full code examples in Python, and links to all the tools covered in the book.
Science has already reaped the benefit of network and graph theory, which has powered breakthroughs in physics, economics, genetics, and more. This book brings those proven techniques into the world of business, finance, strategy, and design, helping extract more information from data and better communicate the results to decision-makers.
Study graphical examples of networks using clear and insightful visualizations
Analyze specifically-curated, easy-to-use data sets from various industries
Learn the software tools and programming languages that extract insights from data
Code examples using the popular Python programming language
There is a tremendous body of scientific work on network and graph theory, but very little of it directly applies to analyst functions outside of the core sciences – until now. Written for those seeking empirically based, systematic analysis methods and powerful tools that apply outside the lab, Graph Analysis and Visualization is a thorough, authoritative resource.
