هوش کسبوکار خود را به سطح جدیدی سوق بدهید که تعاملی، مشارکتی و حتی سرگرمکننده است و با تصمیمگیریهای دقیق به موفقیت تجاری منجر میشود.
این کار را از طریق قدرت مصورسازی، بهکمک ویرایش جدید کتاب حاضر انجام دهید که ویژگیهای جدید و پشتیبانی بیشتری جهت مصورسازی در برنامه Excel 2016 را پوشش میدهد و آخرین تحولات موجود در ابزارهای Get & Transform و DAX را توصیف میکند. علاوهبراین مجموعه دادههای نمونه، برای توصیف تمام آنچه مجموعه خدمات هوش تجاری مایکروسافت اکنون قادر به انجام آن میباشد در ویرایش جدید بهروز شده است. Power View، ابزار جدید مایکروسافت برای مصورسازی و آنالیز داده شبکه ادهاک است که برای تولید خروجی زیبا و به لحاظ تصویری جذاب، همچنین برای افزایش تجربه کاربردی از طریق تعاملات جلادادهشده، طراحی شده است.
Power Map، یک مکانیسم قدرتمند مشابه برای آنالیز داده در سرتاسر واحدهای جغرافیایی و سیاسی است.
Get & Transform، به شما اجازه میدهد تا دادههای خود را از چندین منبع، بارگذاری کنید، شکلدهید و آن را ساده کنید.
Power Pivot میتواند داده را بهسمت یک مدل پویا، گسترش و توسعه دهد.
Power BI، به شما اجازه میدهد تا یافتههای خود را با مراکز دانشگاهی به اشترک بگذارید و اطلاعات خود را به مشتریان ارائه دهید.
کتاب مصورسازی داده با تاثیرگذاری بالا، به شما کمک میکند تا بر این مجموعه از ابزارهای قدرتمند مایکروسافت مسلط شوید، شناسایی منابع داده و صرفهجویی در زمان از طریق آمادهسازی صحیح دادههای اساسی خود را یاد خواهید گرفت، همچنین ارائه مصورسازی و آنالیز قدرتمند از طریق خدمات ابری به کامپیوترها، تبلتها و گوشیهای هوشمند را یاد خواهید گرفت.
آنچه در این کتاب یاد خواهید گرفت شامل تولید خروجی طراح، به گونهای که کارفرمایان و همتایان خود را مبهوت کند، هدایت هوش تجاری از اکسل با استفاده از ابزار BI در خدمات ابری، جمعآوری داده منبع از منابع شرکتهای بزرگ و عمومی، ادغام نمودارها، نقشهها و جداول برای ارائه اطلاعات بصری خیرهکننده، کشف درک جدید، با دستکاری و خردکردن دادهها برخلاف روال گذشته، سازگاری ارائه به دستگاههای موبایل، تاثیرگذاری بر محصولات رقیب و افزایش مهارتهای موجود میباشد.
سال انتشار: 2016 | تعداد صفحات: 599 | حجم فایل: 29.70 مگابایت | زبان: انگلیسی
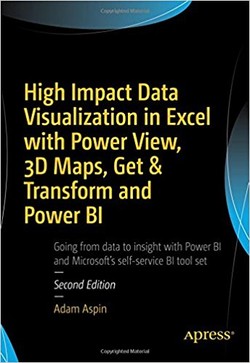
High Impact Data Visualization in Excel with Power View, 3D Maps, Get & Transform and Power BI
نویسنده:
Adam Aspin
ناشر:
Apress
ISBN10:
1484223993
ISBN13:
9781484223994
